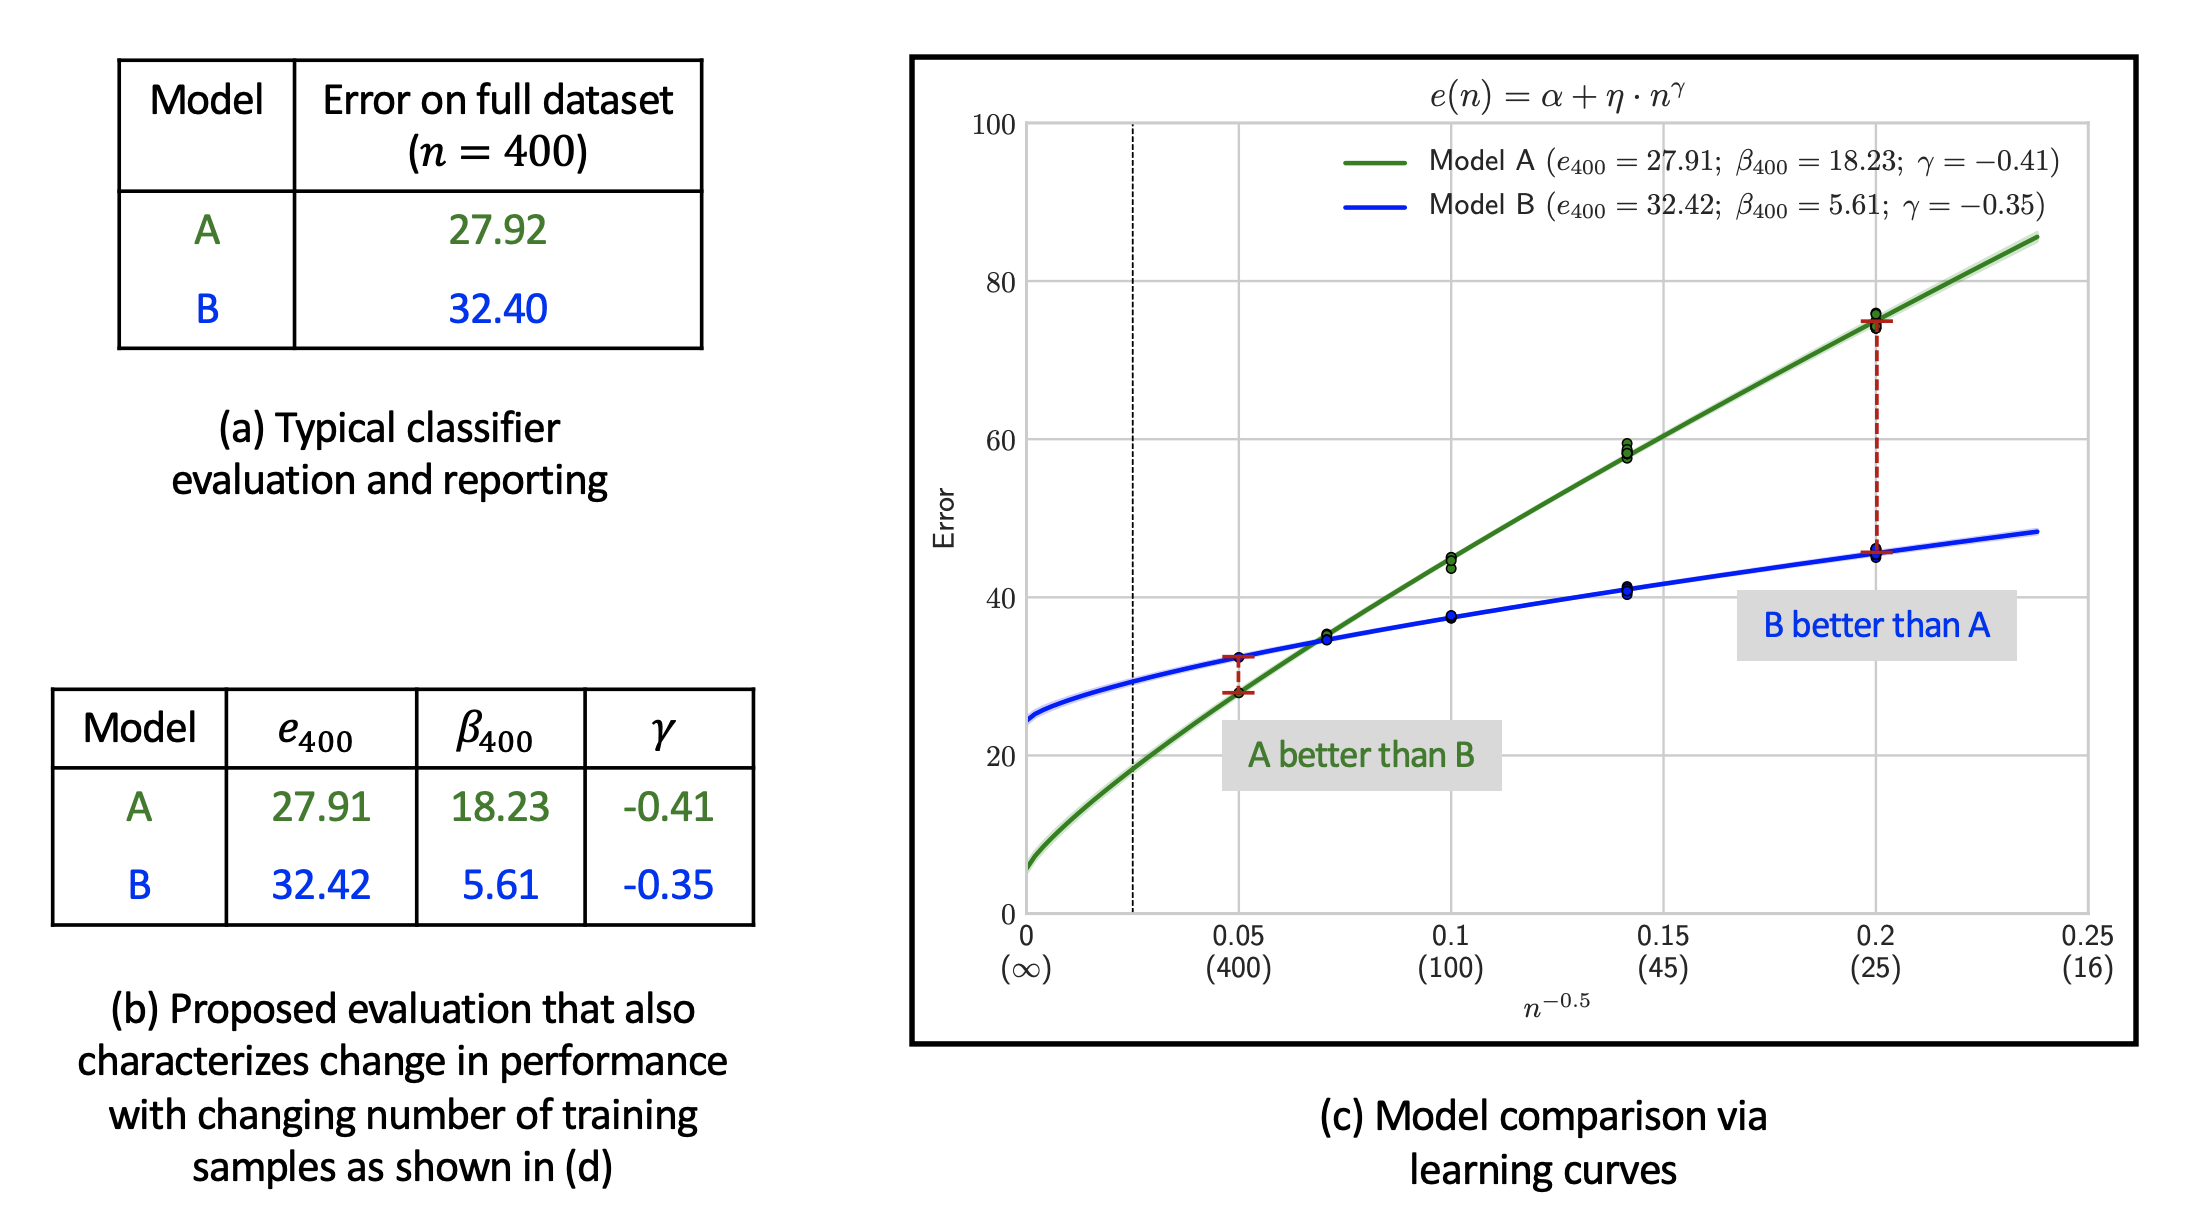
For any given dataset, it is typical to compare two classifiers A and B based on their classification error on the test set when trained on the full training set as shown in (a). These classifiers may differ in architecture design, training techniques, or the choice of hyperparameters. While such a comparison may establish model A to be better than model B when trained on the full training set, it provides an incomplete view of performance. By computing a learning curve, we may find the opposite to be true in the low data regime as shown in (c) which depicts learning curves for two real classifiers trained on the Cifar100 dataset.
We show that a learning curve is not only easy to compute (using only 3 error measurements!) but may also be reliably summarized using error and data-reliance as shown in (b). This summarization allows easy reporting of learning curves in a tabular form while retaining the ability to provide an estimate of classifier performance if the amount of training data was changed by a certain factor - for instance by 4x or 0.25x.
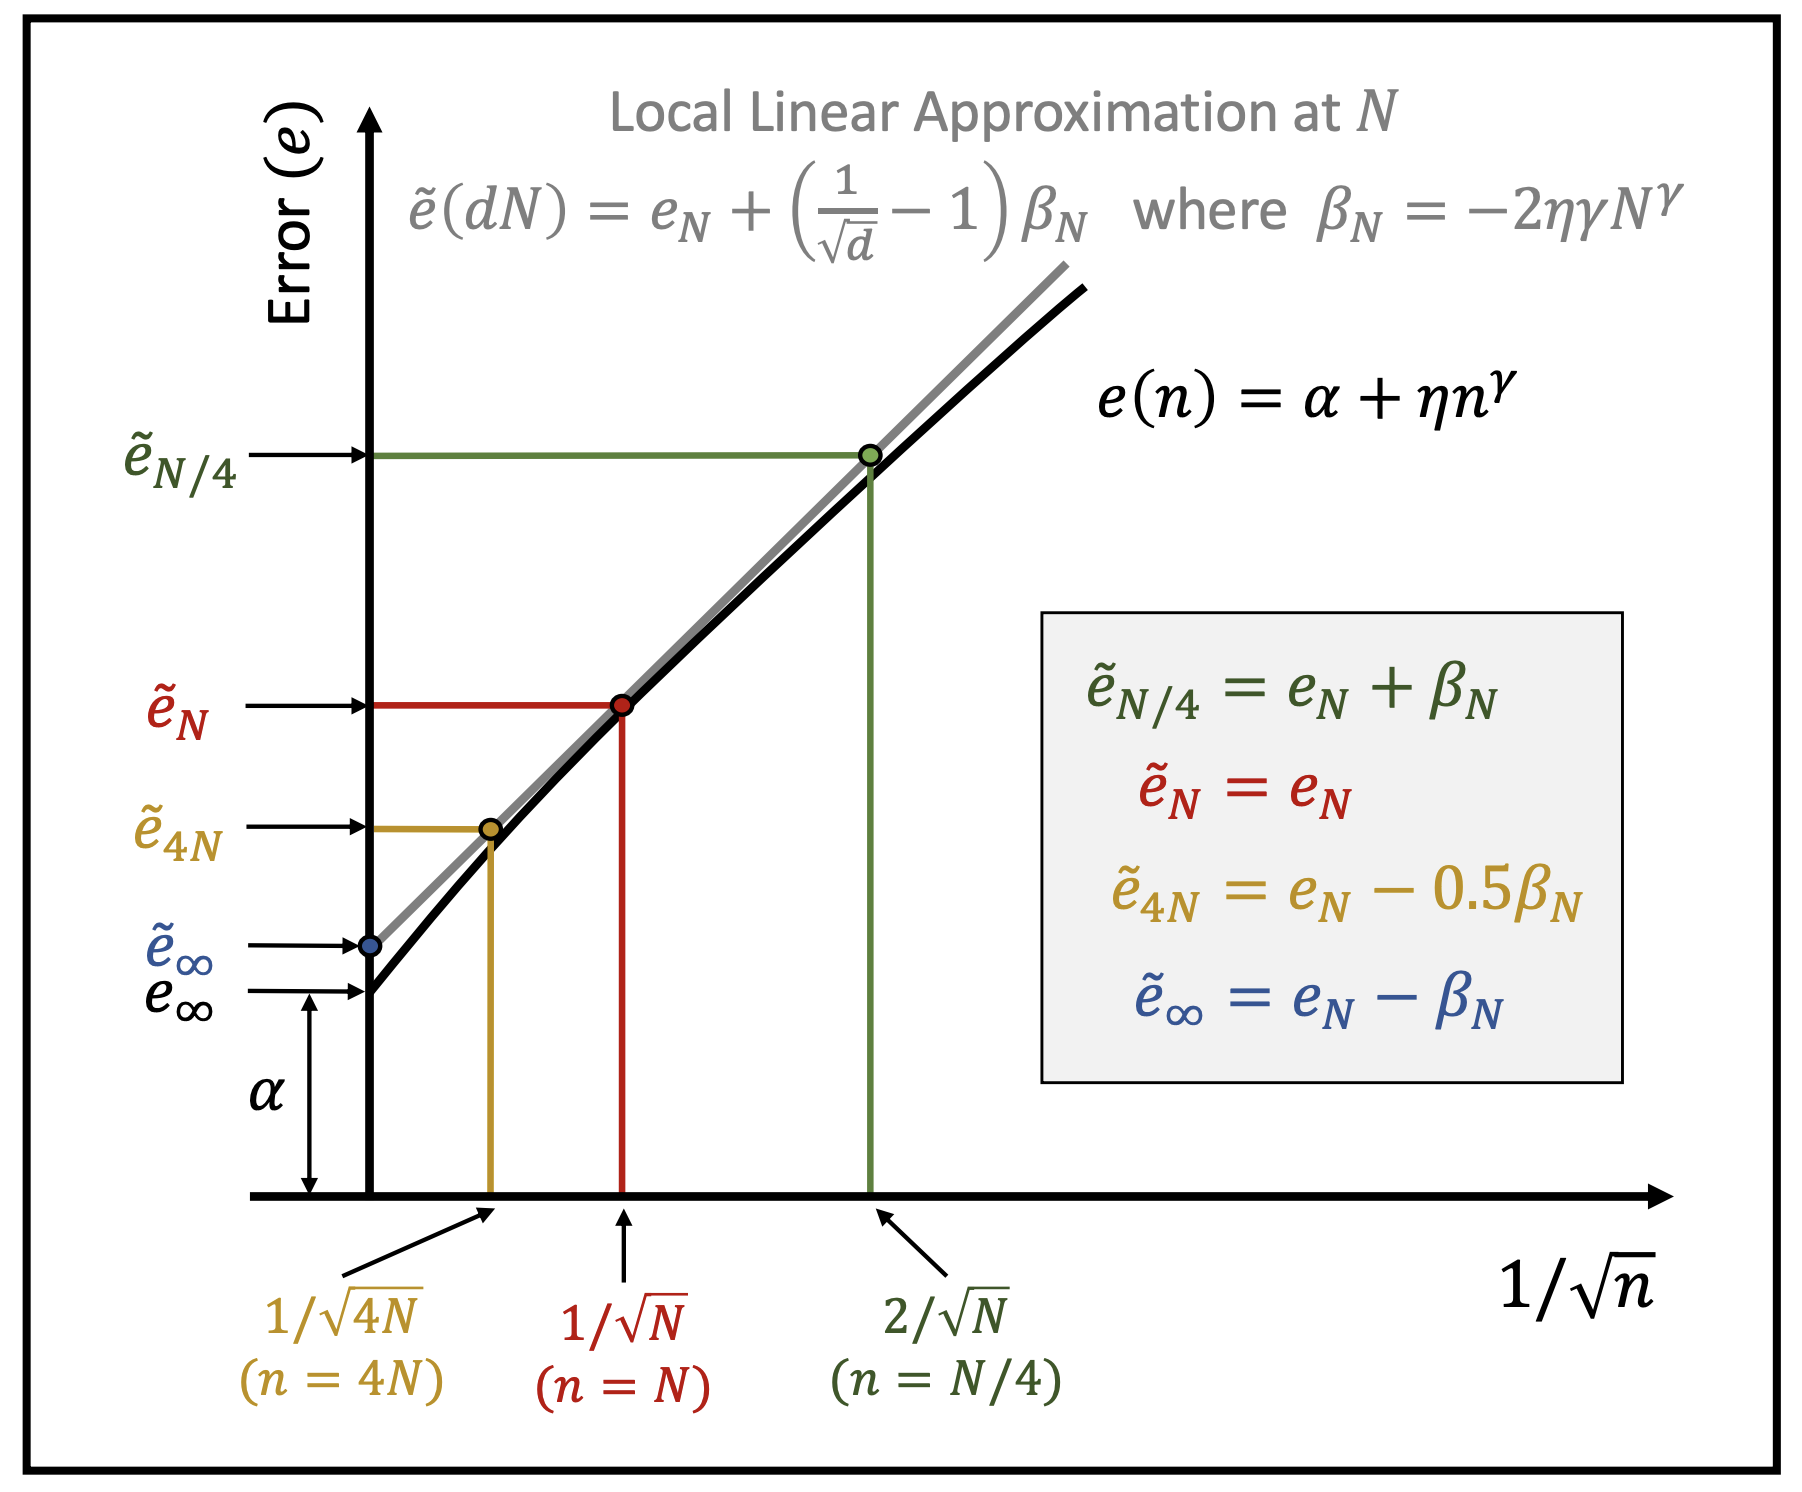
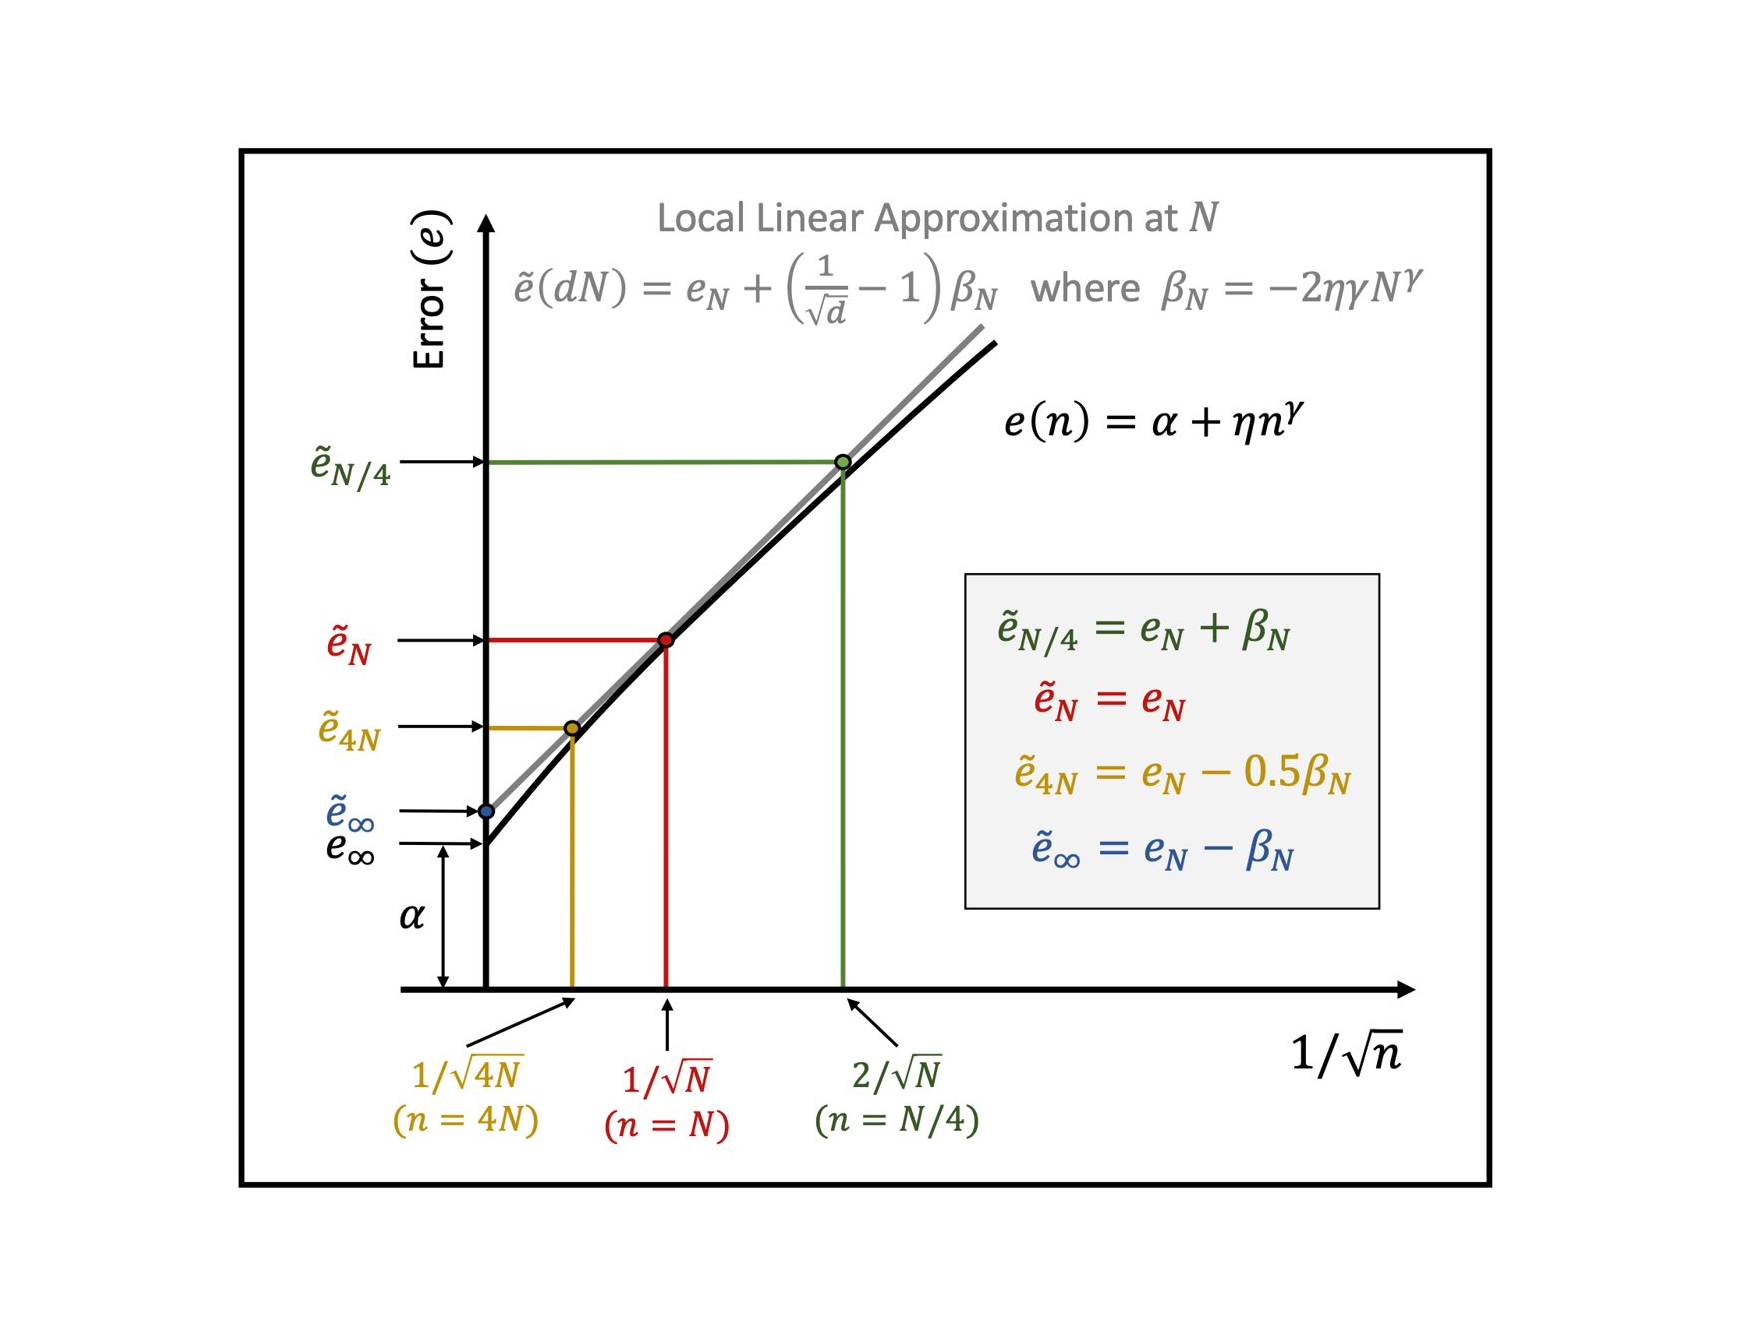
We summarize a learning curve using a local linear approximation of the curve around the desired training set size N. Typically, we care about performance in the vicinity of the full training set size. If so, N may be set to the number of samples in the full training set. The approximation consists of two terms:
In the figure above, d is the factor by which the training set size is multiplied. The shaded block provides simple formulae for computing performance at quarter, quadruple, and infinite training data using the linear approximation. In practice, we have found reliable predictions upto 4x the full training set size. Such information may be incredible useful for deciding whether to simply collect more data or to invest in architecture or training improvements.
Performance of classifiers today are governed by a myriad design decisions such as network architecture, normalization techniques, data augmentation, pretraining, and the choice of optimizer to name a few. Knowing whether a particular design decision improves the error, or data-reliance, or both is vital for evaluating these choices and for creating more principled and targetted solutions.
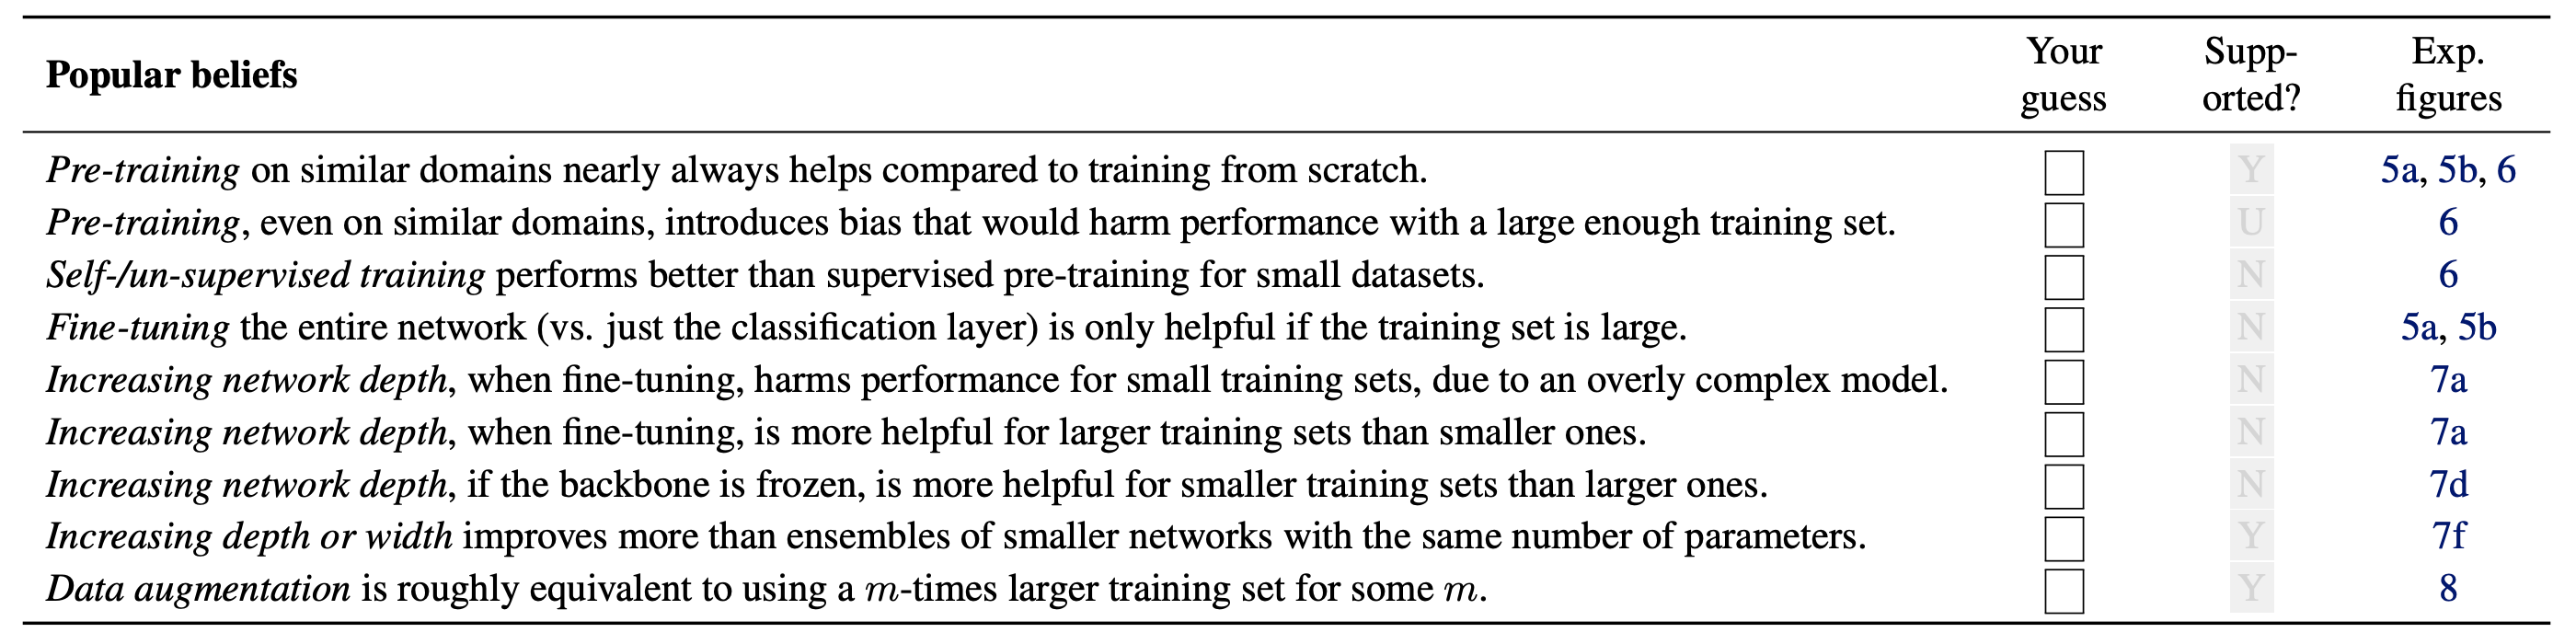
In our paper, we exemplify the use of learning curves by analyzing a wide range of common design decisions that go into building deep neural classifiers. The above table lists a set of popular beliefs among deep learning practioners. We encourage readers to first judge each claim as True or False and then see if our experimental results support the claim (Yes / No / Unsure). We hope our analysis encourages more ML practioners to adopt learning curves to systematically investigate classifier design choices.
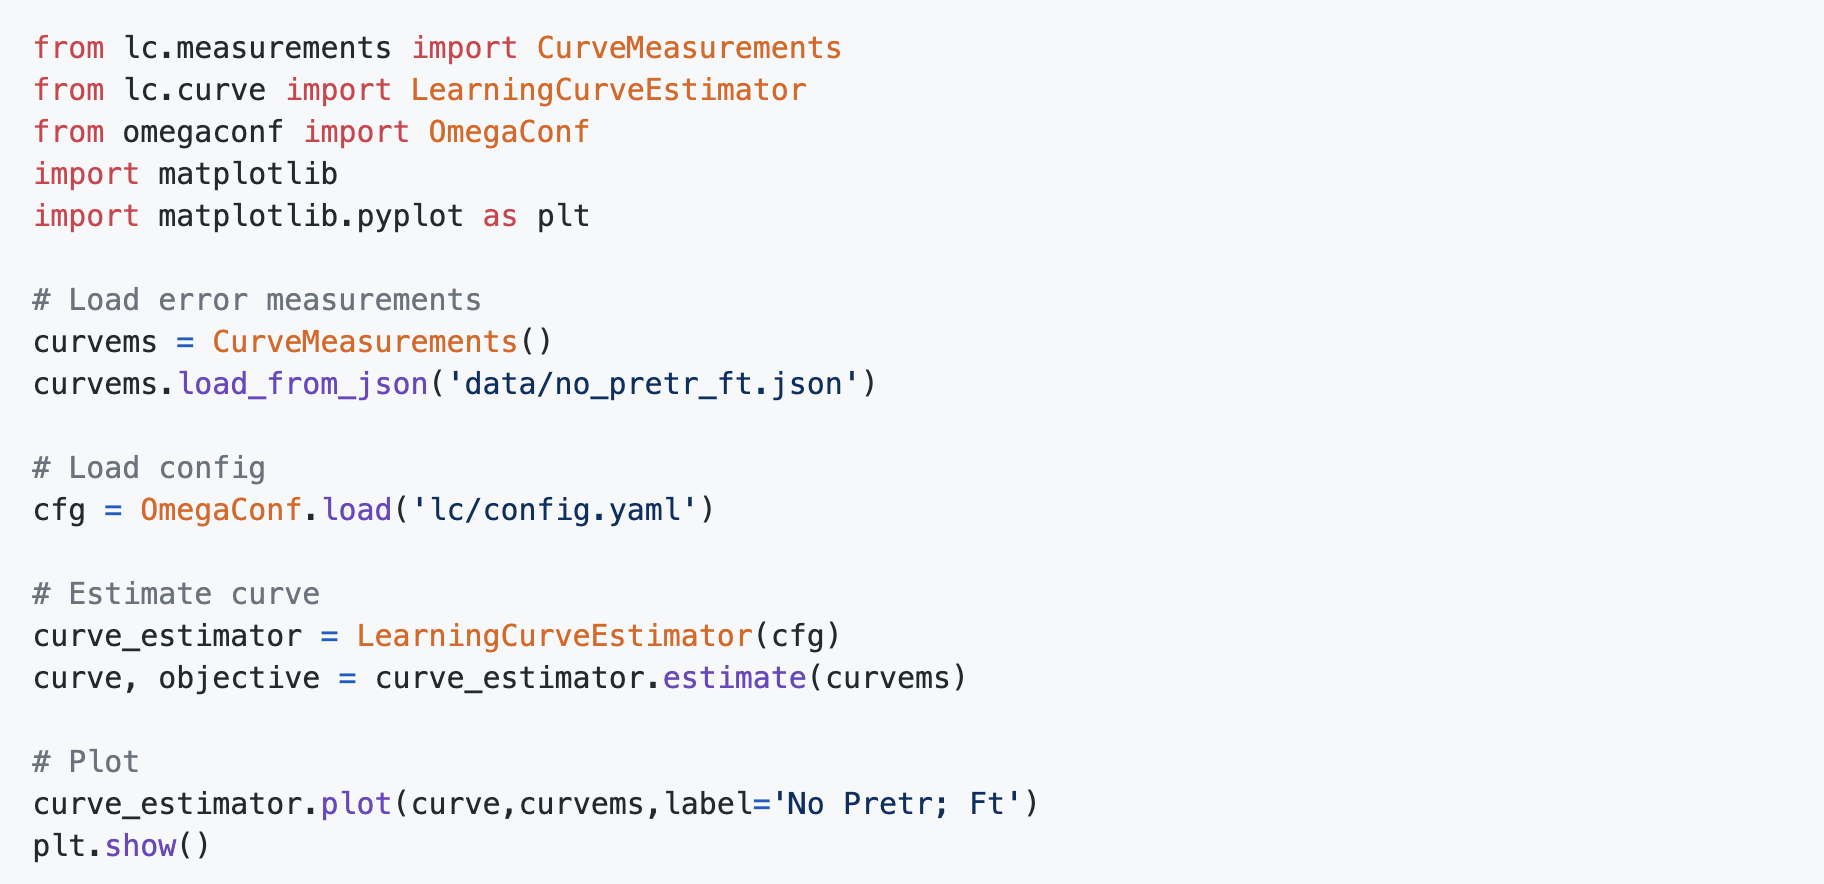
Given error measurements, we make it really easy to compute, plot, and compare learning curves using only a few lines of code. We also provide detailed interactive notebooks to help you dig deeper into learning curves. After all, using learning curves in your next project should not require a steep learning curve!